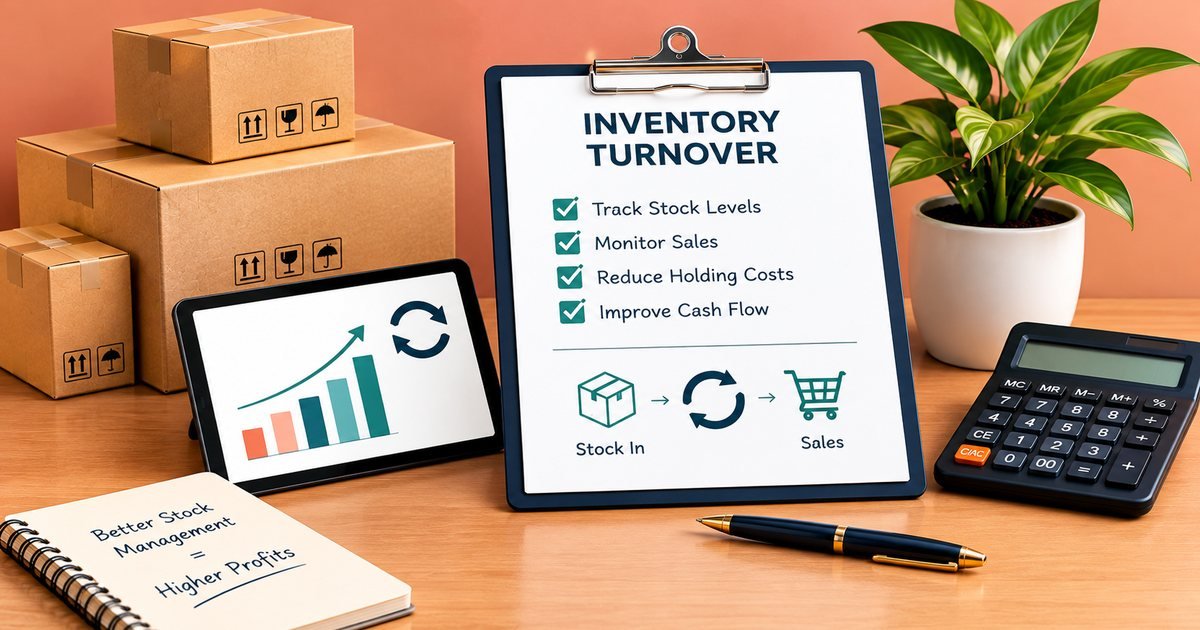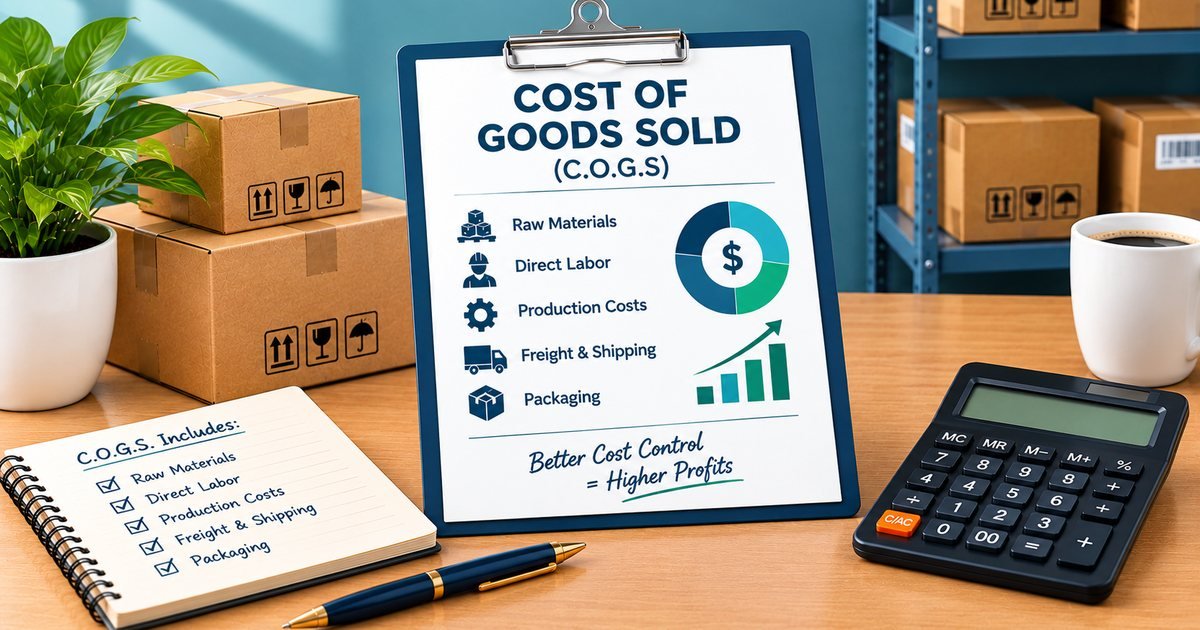
Stock sitting on a shelf looks like an asset, and it is, but it also quietly costs money every day. These holding costs, also called carrying costs, rarely appear on a single line in your accounts, so many businesses underestimate them. Seeing them clearly changes how you buy, price and clear stock.
What carrying costs include
Carrying costs are everything you spend to hold inventory over time. They usually fall into five groups: the cost of money tied up in stock, storage space, insurance and taxes, shrinkage and damage, and obsolescence.
The five parts
Capital cost. The money in stock could have repaid a loan or earned a return. Use your loan interest rate or the return you would otherwise get. Storage. Rent, utilities, shelving, handling labour and software. Insurance and taxes. Cover for the stock itself and any property taxes on it. Shrinkage and damage. Theft, breakage, miscounts and spoilage. Obsolescence. Items that go out of fashion, expire or are replaced by newer versions.
A worked example
A business holds an average of 50,000 of stock. Suppose capital cost is 8%, storage 6%, insurance and taxes 2%, shrinkage and damage 3% and obsolescence 3%. The carrying cost rate is 22%, so the yearly cost is 50,000 × 22% = 11,000. That is money that does not appear as a purchase, yet it leaves the business every year. Many businesses use rates in the range of 20% to 30%, but yours depends on your products and costs.
Cost per unit
The same rate applies to individual items. A product that costs 12 carries about 2.64 a year to hold. If it sits for two years, it costs 5.28 more before you sell it, which can wipe out a sizeable part of a small margin. This is the figure to use as holding cost in the EOQ formula. See our guide on economic order quantity.
The cost of dead stock
Stock that does not sell is the worst case. If 4,000 worth of goods sits unsold for two years, the carrying cost at 22% is 4,000 × 22% × 2 = 1,760, on top of what you paid for them. It is often cheaper to sell such stock at a heavy discount than to keep paying to store it.
How to find your own rate
Add up your yearly costs for each of the five parts, divide by your average inventory value, and multiply by 100. Use actual figures where you can: storage costs from your rent, insurance from your policy, shrinkage from your stock counts. Where you must estimate, be conservative, then refine as your records improve. Our carrying cost calculator does the arithmetic.
Ways to reduce carrying costs
- Raise turnover. Sell stock faster, by promoting slow items or ordering less of them. See inventory turnover.
- Order smaller quantities more often, where ordering costs allow it.
- Clear dead stock before it ages further.
- Improve forecasting so you buy what you will sell.
- Negotiate storage costs and supplier terms, such as consignment or faster delivery.
- Count and secure stock to cut shrinkage.
Do not cut too far
Lower stock reduces carrying costs, but too little stock means missed sales. The aim is the right amount, not the smallest amount. Balance the carrying cost against the cost of running out, using your safety stock levels and your fill rate.
Include it in your pricing
Products that spend a long time in stock cost more to hold, and that should be part of your price. If a slow, bulky item has high carrying costs, its true margin is lower than its price suggests. Look at the margin after holding costs when you compare products.
Where the numbers hide in your accounts
The figures are usually there, just not labelled. Capital cost appears as interest on loans or overdrafts. Storage is part of your rent and utilities: if stock takes up 40% of your floor space and rent is 12,000 a year, 4,800 of it is the cost of storing stock. Insurance is on your policy, shrinkage shows up in stock adjustments and write-offs, and warehouse labour is in your payroll. Pulling these together once gives you a far better rate than a guess.
Quick wins for the first month
List your slowest 20 products by value and decide what to do with each one: discount, bundle, return or stop reordering. Count the stock you suspect is wrong. Reduce safety stock on slow items that you can reorder quickly. And look at your last three large purchases and ask whether a smaller order would have been enough. These steps cost little and often release cash within weeks.
Review once a year
Rent, interest rates and insurance change, and so does your product range. Recalculate your carrying cost rate each year and whenever something significant changes. This guide is general information, so use your own records for the numbers.